Data logging and visualisation
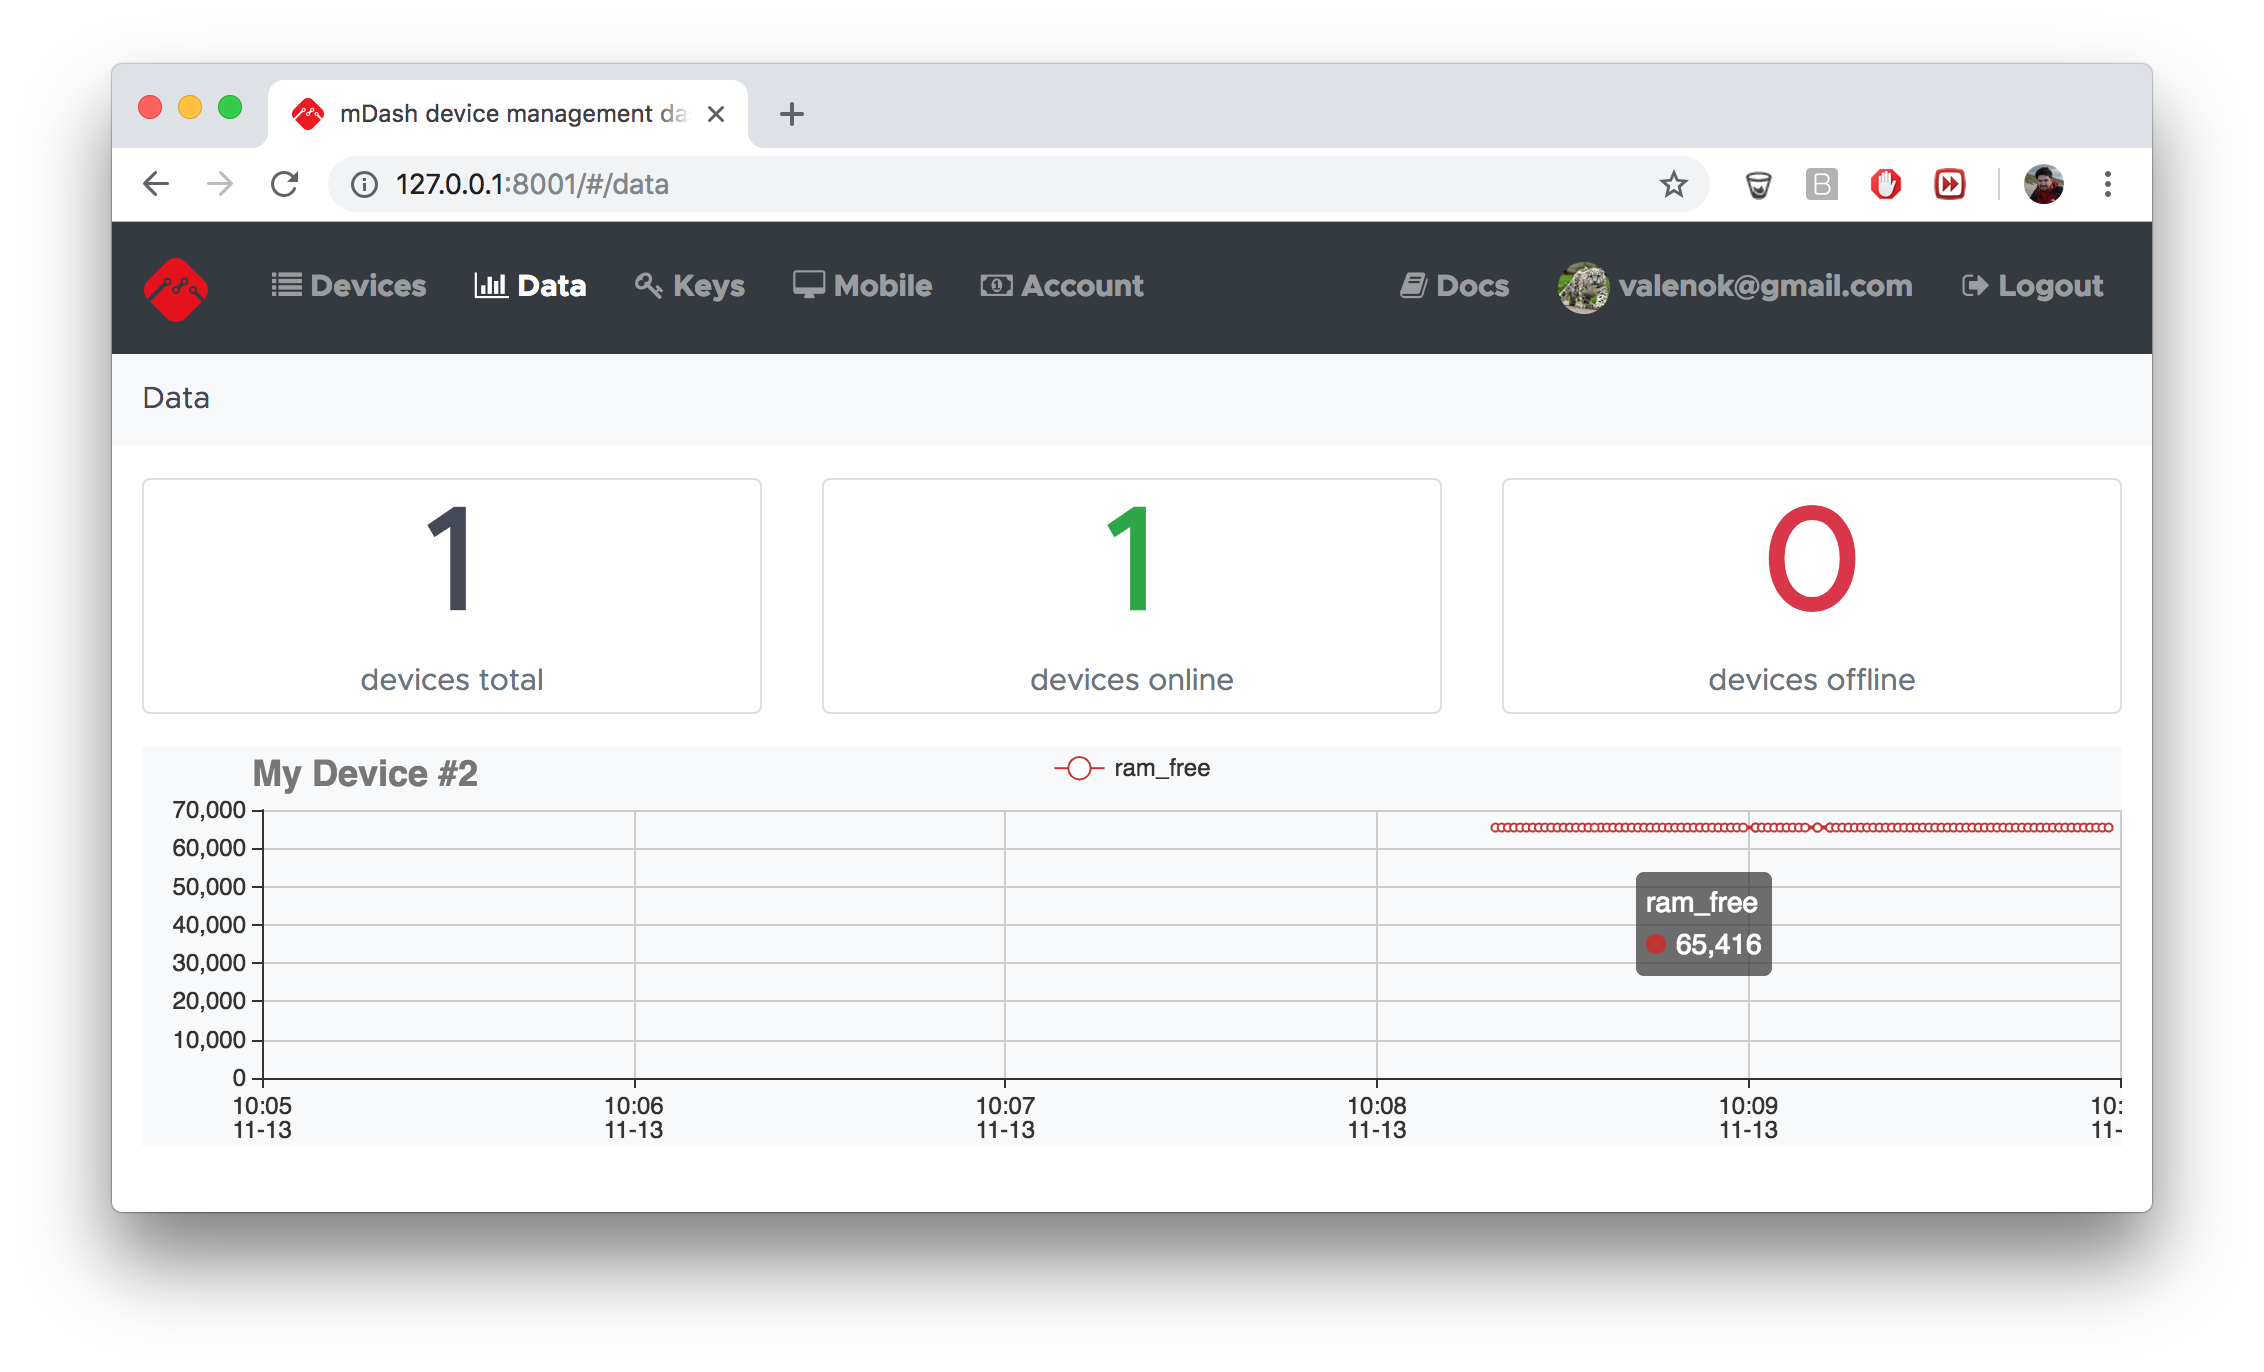
mDash provides an experimental support for data logging and visualisation:
How to enable data log on mDash
mDash can be instructed to save certain device shadow values into a persistant database. Currently, up to 100 data points can be saved. In the future, the number of datapoints will be unlimited.
In order to select which device shadow values get logged, modify the
tags.save array, which is the array of shadow keys to log.
By default, it is set to save only ram_free metric. That metric gets
reported by the demo-js default firmware.
On mDash, click on the device name. In the device shadow editor, edit
the tags value and save. For example, to log ram_free and my_value, do:
  ...
  "tags": {
    "save": [
      "ram_free",
      "my_value"
    ]
  },
  ...
How to log data from a device
Device logs data via the device shadow update. Here how it is done in C/C++:
#include "mgos.h"
#include "mgos_shadow.h"  // make sure to include "shadow" lib in mos.yml

// Somewhere in your code ...
mgos_shadow_updatef(0, "{my_value: %g}", 1.2345);
And in JavaScript:
load('api_shadow.js');

// Somewhere in your code ...
Shadow.update(0, JSON.stringify({my_value: 1.2345}));
See Device shadow section for the detailed device shadow explanation.
How to test data logging
You can easily simulate your device and log data from your workstation.
Essentially, logging data is updating a device shadow. You can update device
shadow via the REST API by sending a POST request to the /devices/:id
endpoint (don't forget to change both API_KEY and DEVICE_ID):
curl -H 'Content-Type: application/json' \
  -H 'Authorization: Bearer API_KEY' \
  -d '{"shadow": {"state": {"reported": {"ram_free": 12345}}}}' \
  https://dash.mongoose-os.com/api/v2/devices/DEVICE_ID