Debugging tools
Mongoose OS provides several ways to debug firmware functionality. They are listed below in the order of complexity.
Increase debug log level
There is a top-level debug section in the configuration. It could be
inspected by clicking on a "Device config" tab in the GUI, or through the
command line:
mos config-get debug
{
  "factory_reset_gpio": -1,
  "level": 2,
  "mbedtls_level": 0,
  "mg_mgr_hexdump_file": "",
  "stderr_topic": "esp8266_067082/log",
  "stderr_uart": 0,
  "stdout_topic": "esp8266_067082/log",
  "stdout_uart": 0,
  "udp_log_addr": ""
}
The default level is 2. Level -1 means no log. Level 0 is ERROR, 1 is WARN,
2 is INFO, 3 is DEBUG, 4 is VERBOSE_DEBUG. Level 4 means log everything
possible, it is very verbose. Start with increasing to level 3.
Increasing the debug level from the command line
mos config-set debug.level=3
Getting configuration...
Setting new configuration...
Saving and rebooting...
Debug configuration settings quick reference
{
  "factory_reset_gpio": -1,   // Used to reset the device. Hold this pin down and reboot to reset
  "file_level": "",           // Filename and function name prefix match, ie `debug.file_level=mgos_vfs=2,mgos_event.c=2,mg_=2,=3`
  "level": 2,                 // Log verbosity level
  "mbedtls_level": 0,         // Log verbosity level for TLS library
  "mg_mgr_hexdump_file": "",  // Set to "-" to hexdump network packets
  "stderr_topic": "",         // If set, an MQTT topic to send stderr logs to
  "stderr_uart": 0,           // UART number for stderr logs
  "stdout_topic": "",         // If set, an MQTT topic to send stdout logs to
  "stdout_uart": 0,           // UART number for stdout logs
  "udp_log_addr": ""          // Set to "IP_ADDR:PORT" to send logs to this UDP address
}
Notes:
mostool starts a UDP listener on port 1993. Therefore, if you setdebug.udp_log_addrtoYOUR_MACHINE_IP:1993,mostool will start showing your device logs.- If you connect to your device using via Websocket, as
ws://IP_ADDR/rpc, thenmostool automatically sets thedebug.udp_log_addrto the correct value and you don't need to set it up manually. - file_level is a comma separated list of string prefixes, which could be a full or partial start of word match. The number argument sets the maximum log level that will be accepted by files/functions matching it. You can put a 'match all' with a null string and a log level, ie "=3" will match everything and set it to 3 (INFO)
Analysing core dumps
If your app crashes showing a core dump message, you can start GDB against that coredump and analyse the backtrace at the time of the crash, as well as the state of the firmware.
First, save the coredump data to the console.log file.
Then clone the mongoose-os repo:
git clone https://github.com/cesanta/mongoose-osThen from your apps' directory, do
make -C PATH_TO_MONGOOSE_OS_REPO/platforms/esp8266 debug_coredump \
  CONSOLE_LOG=$(pwd)/console.log ELF_FILE=$(ls $PWD/build/objs/fw.elf)
Running a heap log analyser
Heap log analyser is a tool developed by the Mongoose OS team. It is used for detecting memory leaks, and does it in a visual way, allowing to quickly pinpoint the place where a leak is happening.
ESP8266 is the only device this is supported on.
In order to use the heap log viewer, follow the steps below:
Enable heap log tracing
Edit your app's mos.yml, add the following section:
build_vars:
  MGOS_ENABLE_HEAP_LOG: 1
  MGOS_ENABLE_CALL_TRACE: 1
Rebuild your app:
mos build --clean --arch esp8266
...
Run your app to collect the heap log
Your console log will become very noisy lots of hl{...} lines.
Run your app, let it run a few cycles, and save the log somewhere.
If you're on Mac/linux,
mos console | tee /tmp/console.log | grep -av 'hl{'This way you don't see the noise, but it's all logged in /tmp/console.log.
Analyse logs
Clone mongoose-os repo and start heap log viewer tool:
git clone https://github.com/cesanta/mongoose-os
cd mongoose-os/tools/heaplog_viewer/heaplog_server
go build
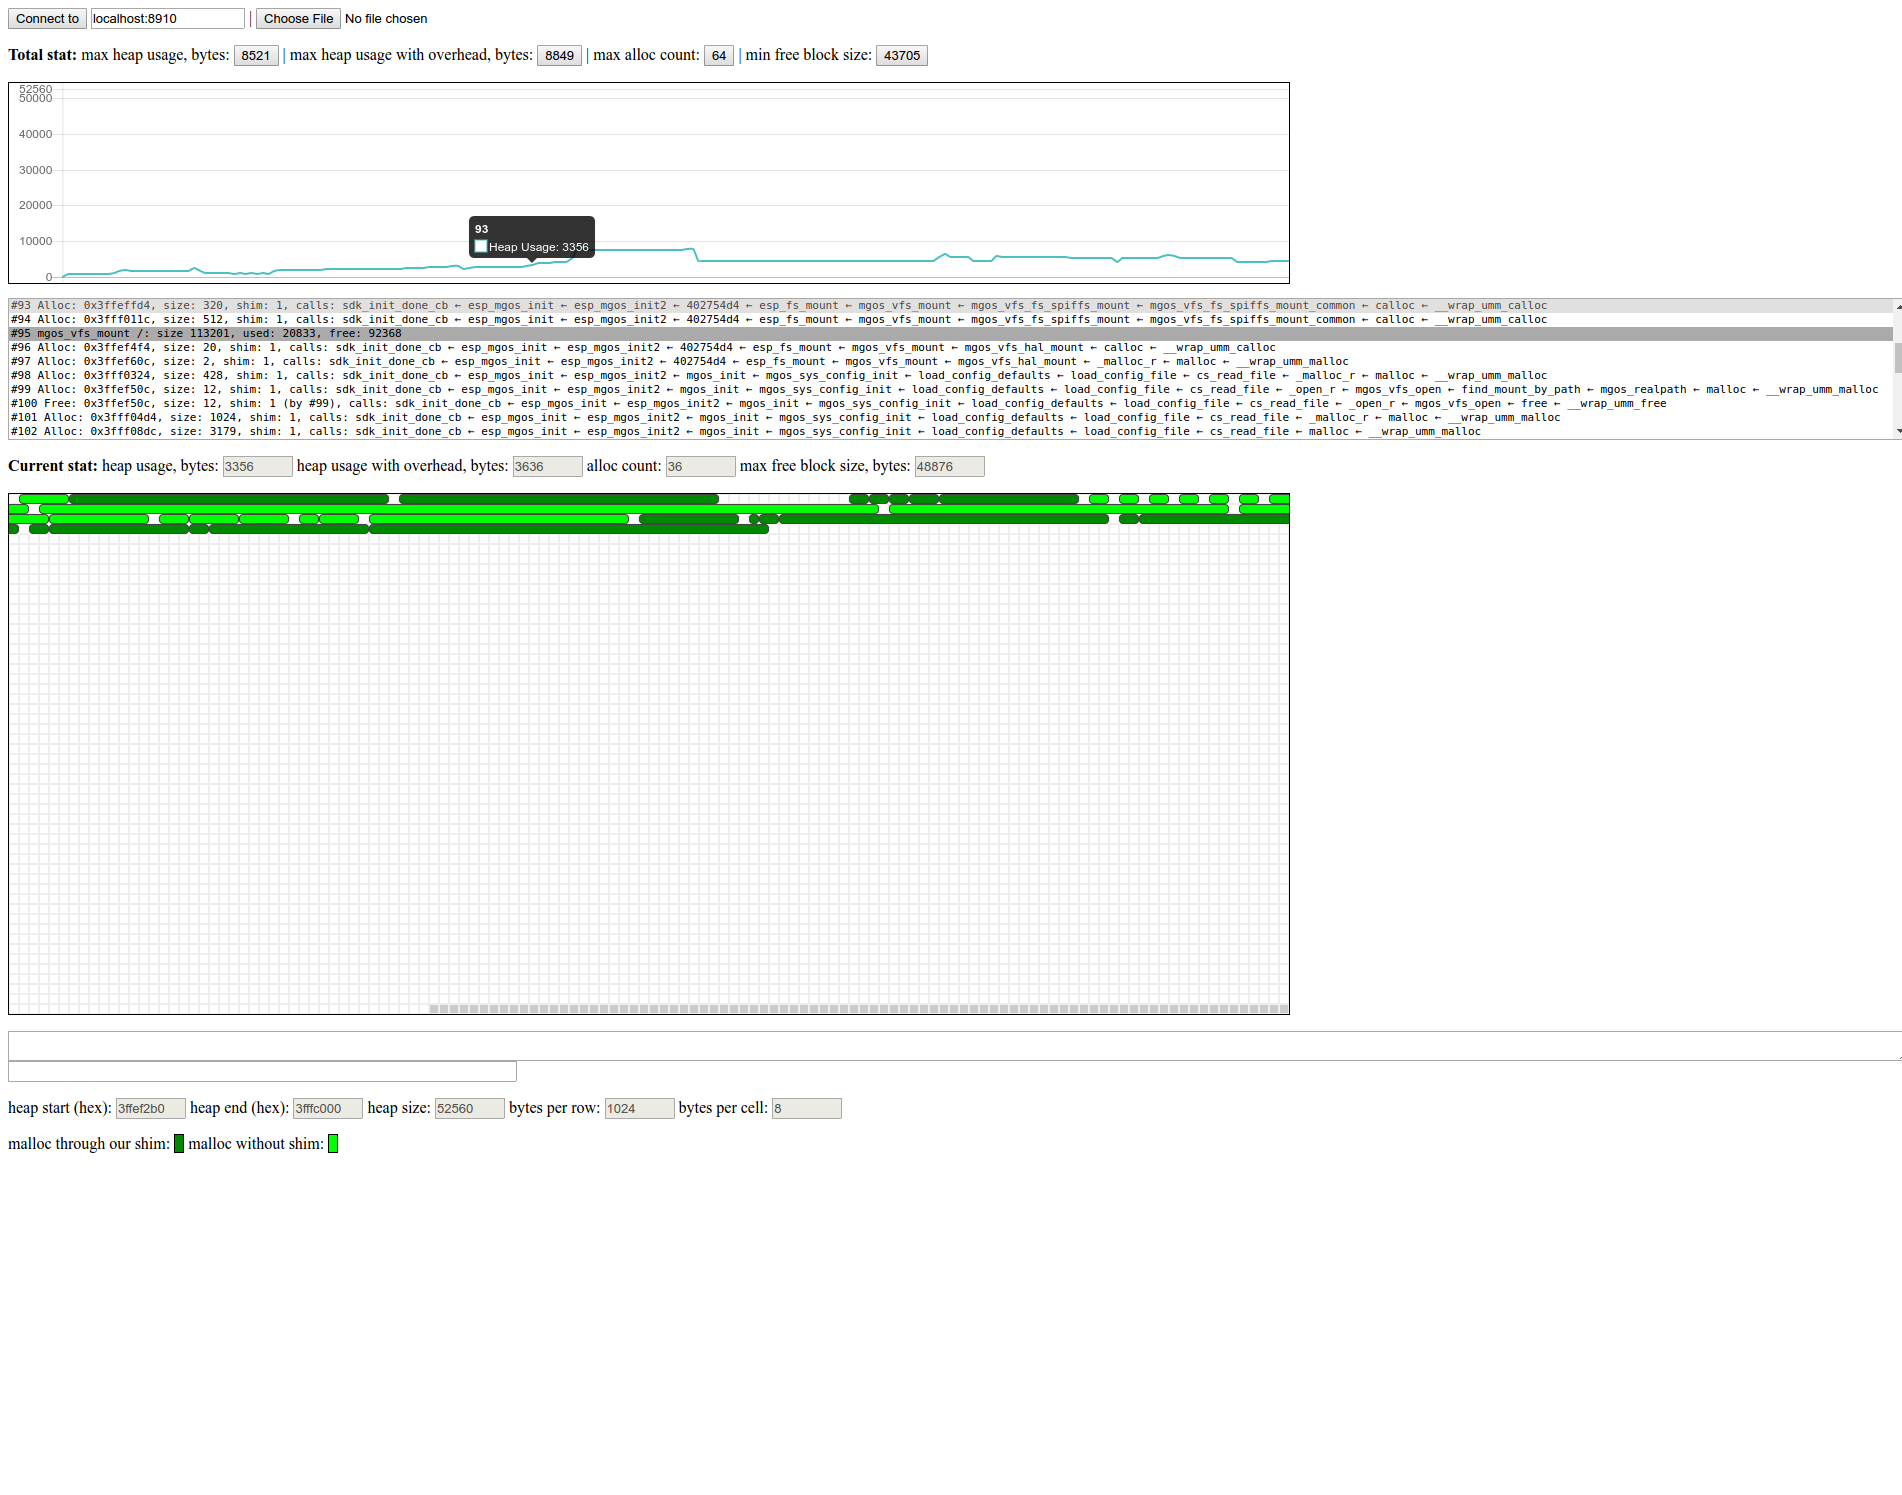
./heaplog_server --logtostderr --document_root .. \
--binary=YOUR_APP_PATH/build/objs/fw.elf --console_log /tmp/console.logPoint your browser at http://localhost:8910/ and press "connect". This should give you a pretty picture like this: